Main dashboard
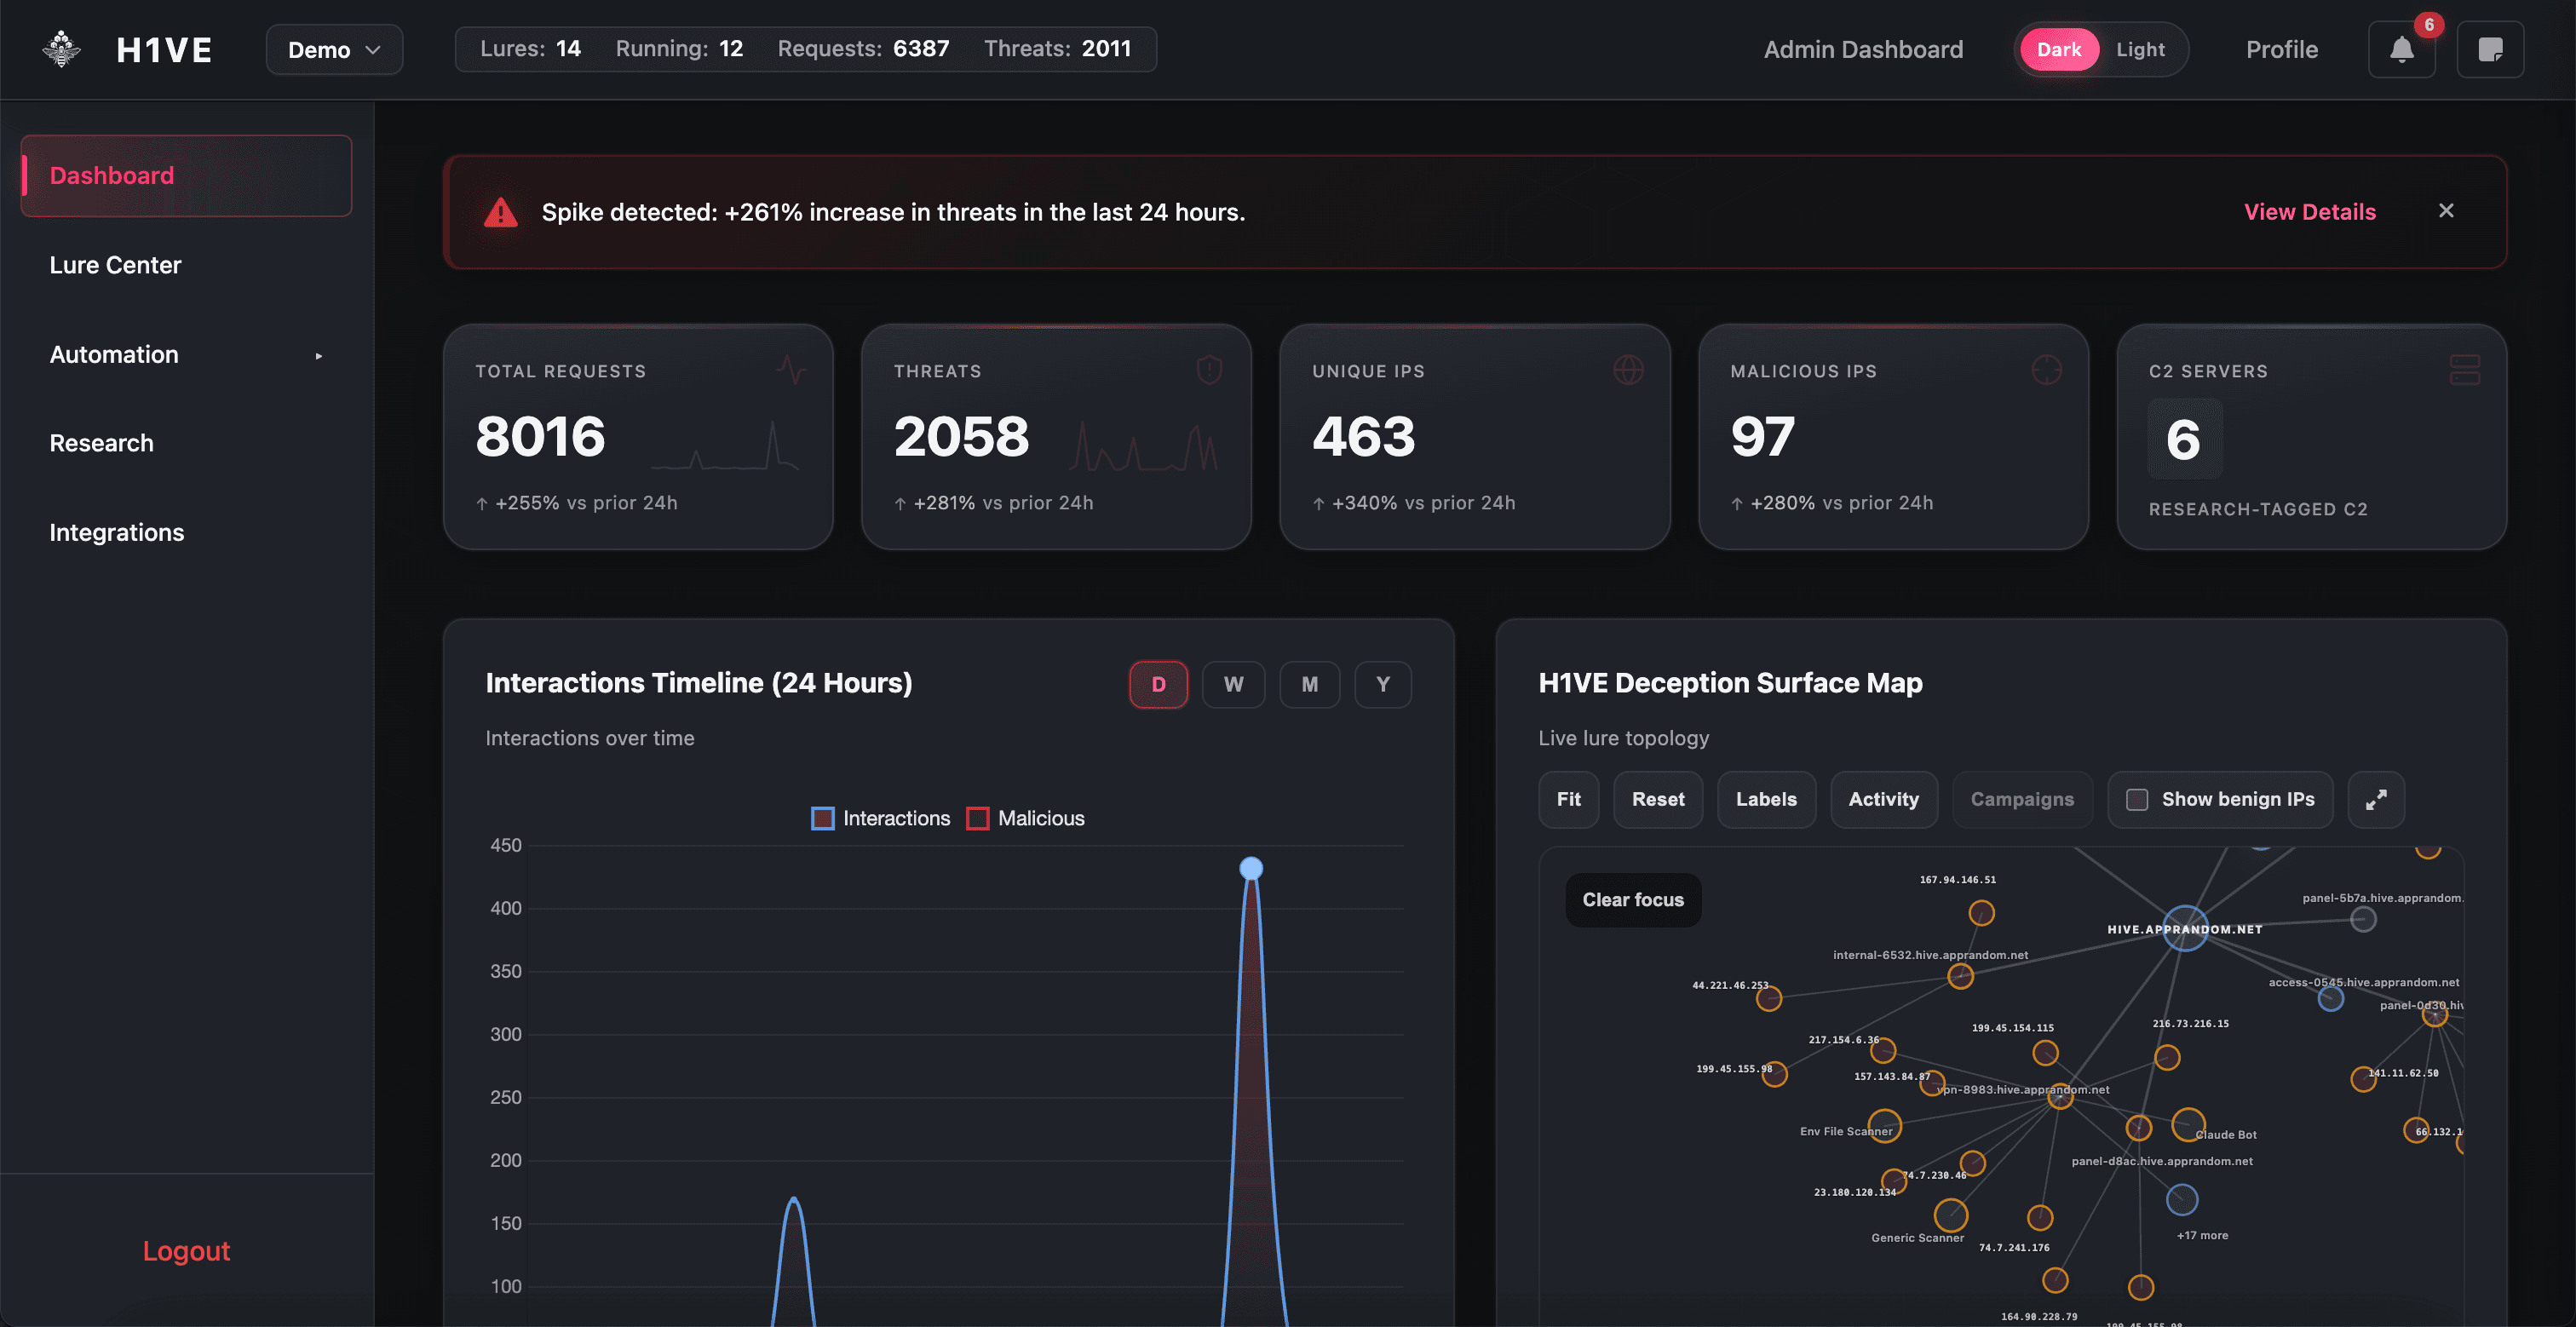
The dashboard answers what is happening right now across your deception fleet. The KPI strip tracks total requests, classified threats, unique IPs, malicious IP count, and C2-tagged sources. When threats spike, start with Recent Threats—sort by severity before volume.
Visual H1VE Deception Surface Map
The Surface Map renders your lure topology as interactive nodes—states include Idle, Scan, and Threats. Expand to full screen; click a node to jump directly to that lure's logs. Busy nodes are your fastest path from macro view to actionable IPs.

Alerts and statistics
Interactions Timeline overlays malicious volume on total traffic—use D for live triage, W/M for campaign waves. Top Statistics ranks lures, domains (when DNS is configured), and IPs with export and Research pivots.
Real-time activity and threat trends
Malicious Activity Type Distribution shows which attack classes dominate your environment—inform the next lure mix (if SQLi dominates, ensure database-adjacent personas exist). Potential 0-Day / Unknown Threats appears only when the engine flags anomalous requests; treat these as immediate triage.
Triage habit
Investigations from the dashboard
Dashboard modals expose request metadata and raw HTTP when captured. Use Details on top IPs to open investigation profiles without rebuilding context manually.