Welcome
This guide is written for security operators, detection engineers, and architects who run H1VE in production—not for casual evaluators skimming feature lists. It documents how the platform is actually operated: where to deploy lures, how traffic becomes investigations, and when automation earns its place in your workflow.
H1VE (Honeypot Intelligence & Visibility Engine) is a deception operations platform. You deploy realistic decoys—lures—that attract scanners, exploit attempts, and post-exploitation behavior. Every interaction is logged, classified, and made actionable through the dashboard, Research workspace, and integrations.
Who this guide is for
- SOC analysts triaging deception alerts and pivoting to IP investigations
- Threat hunters correlating campaigns, payloads, and C2 infrastructure
- Detection engineers tuning suppression, Nuclei rules, and telemetry pipelines
- Platform owners integrating DNS, WAF, SIEM, and attack surface tools
Your first hour with H1VE
Recommended onboarding path
Configure DNS (Technitium or Azure) and optional Slack/WAF. Test each connection before deploying lures.
Start with a familiar surface—Fortinet VPN or Website Clone—on a hostname reachable from your test network.
Confirm interactions appear on the timeline and Surface Map. A silent lure usually means DNS or routing—not H1VE.
Pivot from a malicious IP to Investigation profile, tag, export, or block via WAF integration.
Lab vs production-like
How this documentation is organized
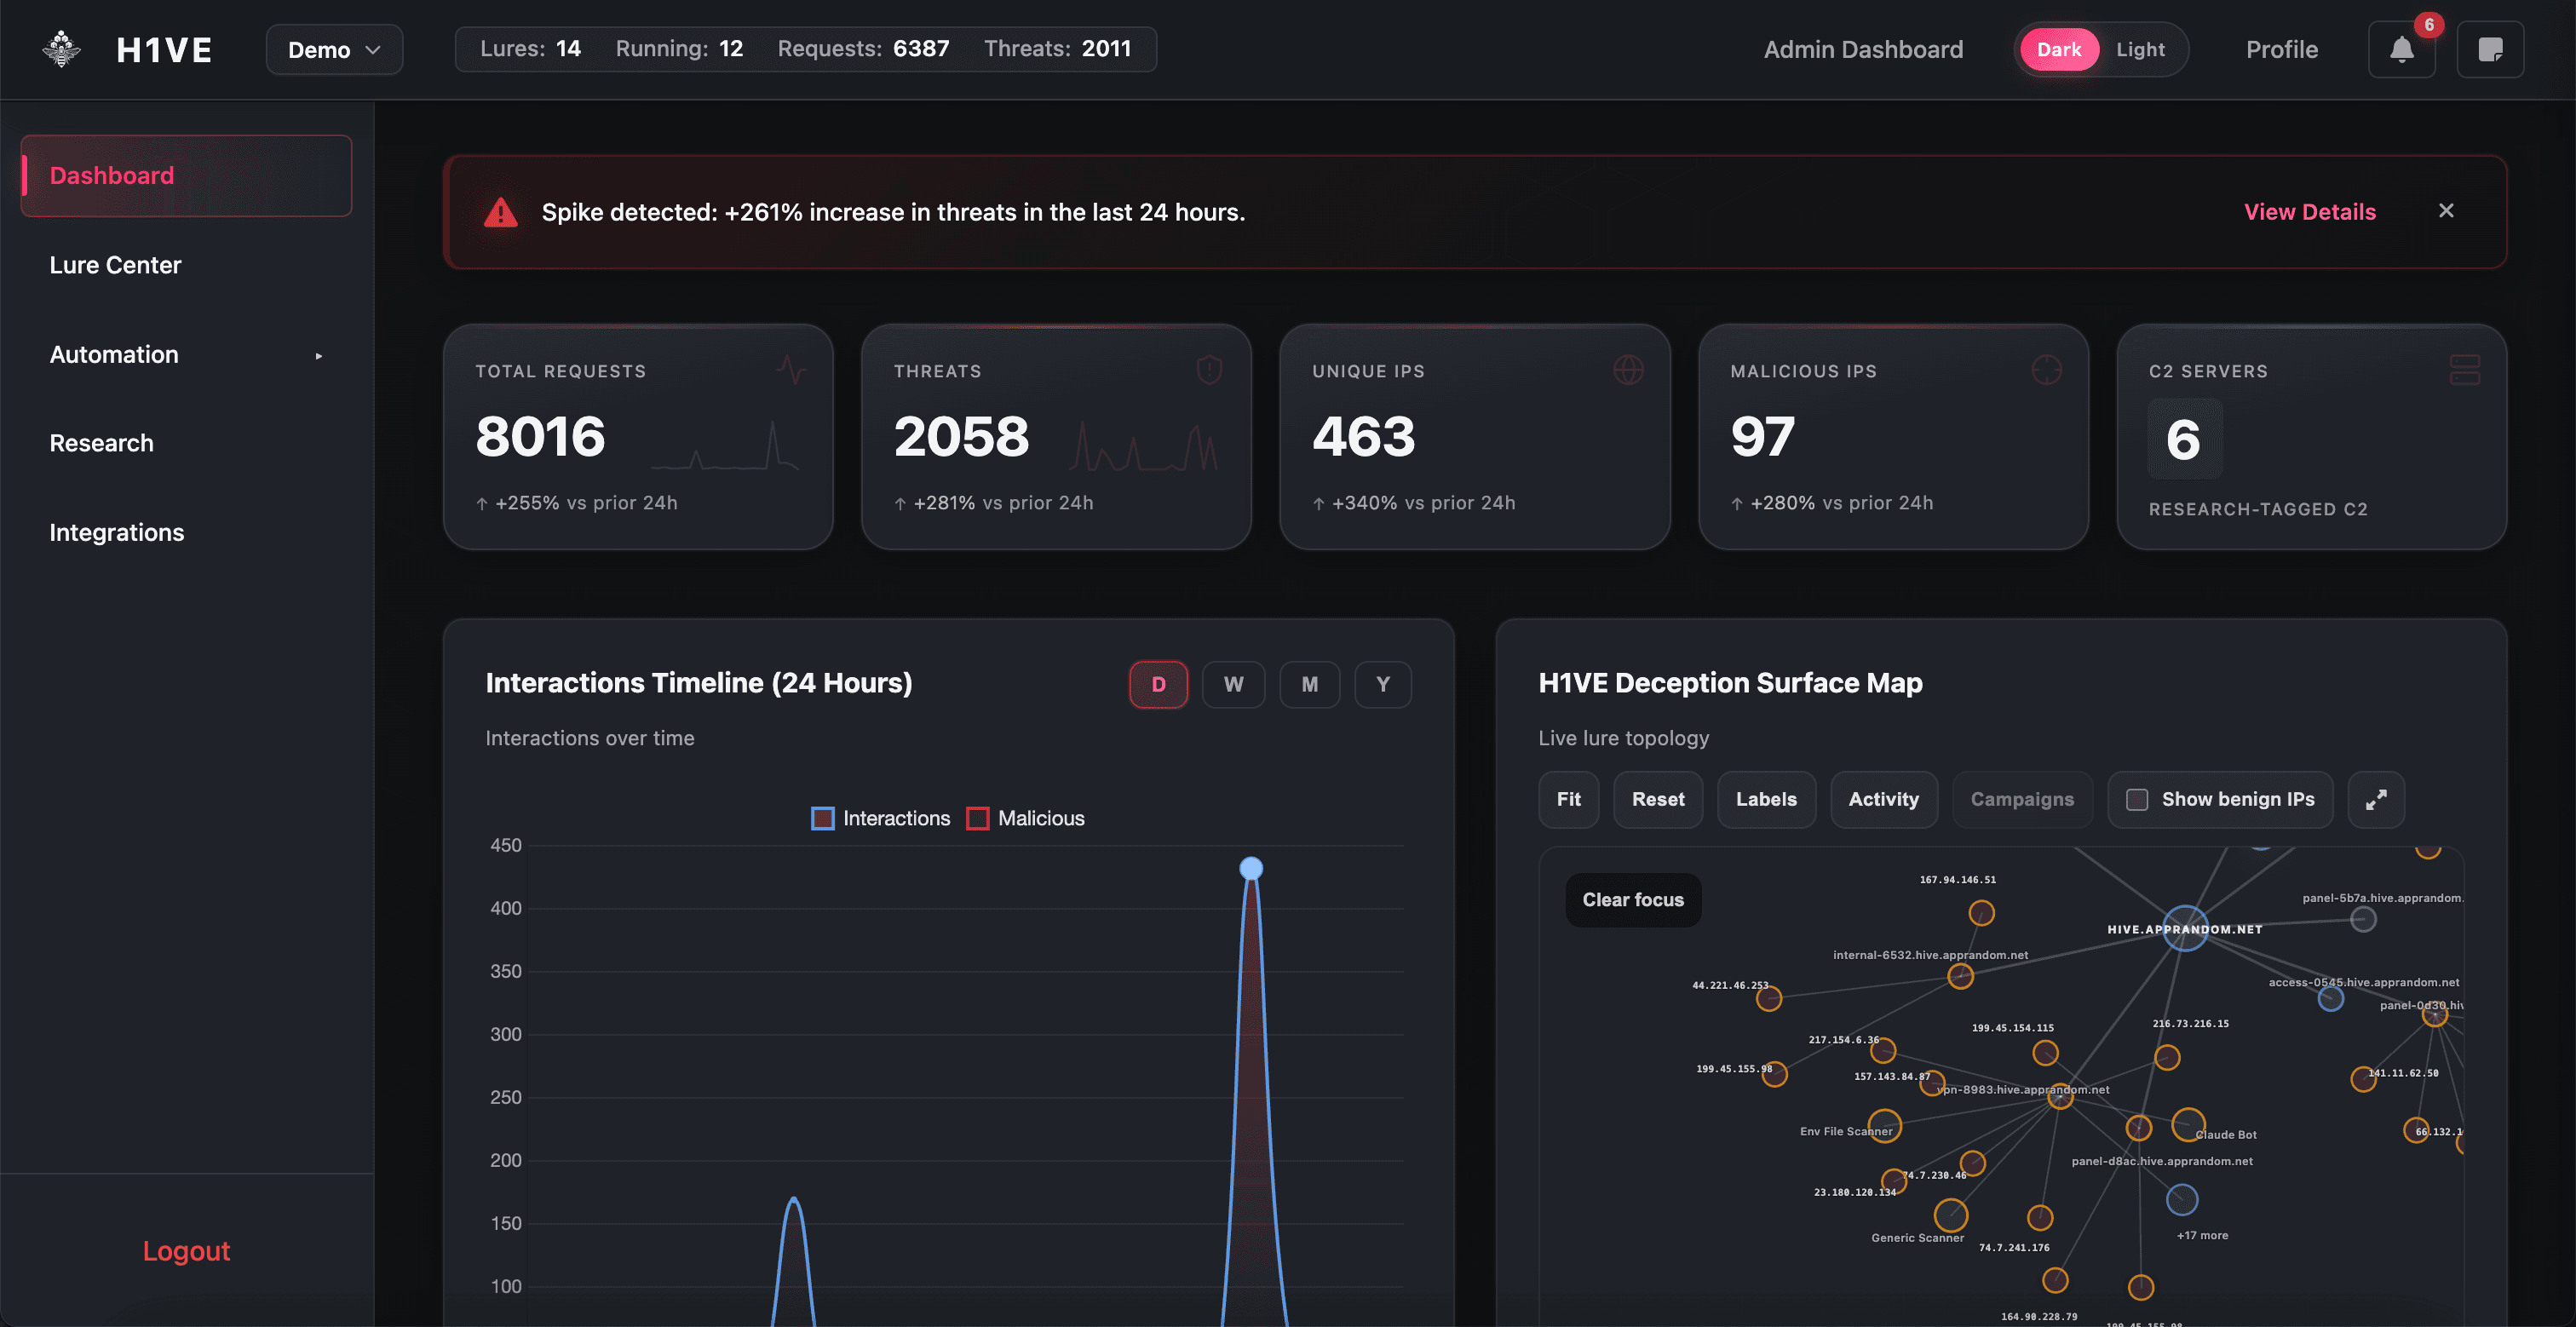
Sections follow the same mental model as the product UI: Introduction → operational guides (Dashboard, Lures, Automation) → Investigation and telemetry depth → Integrations and deployment → API reference. Each page includes screenshot and diagram placeholders so your team can drop in environment-specific captures without restructuring pages.